











Nano Banana 2.1 Infographic Prompts: Create a Clear Process Visual
A tested Nano Banana 2.1 infographic prompt, reusable templates, and a practical checklist for text, hierarchy, arrows, and factual review.
AI infographics often look convincing at a glance while failing on the details: a label is misspelled, an arrow points backward, the reading order is unclear, or decorative text appears that was never requested. The most reliable prompt is not a paragraph about style. It is a compact information architecture.
We tested Nano Banana 2.1 with a four-step “From Rain to Tap” process infographic. One generation produced the exact title, four correctly ordered panels, four exact captions, clear arrows, consistent icons, and no extra words. That is a strong result, but it is still one run; every factual visual should be proofread before publication.
What made the prompt work
It locked five things separately: canvas, panel count, literal text, visual metaphor, and forbidden extras.
Build the information structure before the visual style
Start with the reader’s path through the information. Decide the title, number of sections, order, arrows, and exact copy before describing colors or illustration style. This prevents a beautiful design from hiding a broken explanation.
For a process graphic, define:
- The exact title.
- The exact number and arrangement of panels.
- The title and caption inside each panel.
- The icon or scene that explains each step.
- The direction of connectors.
- The text and elements that must not appear.
Google’s Nano Banana 2.1 model card includes separate evaluations for infographic design and infographic factuality. Our workflow adds a practical safeguard: treat the output as a visual draft and verify every word and relationship against the source material.
The exact prompt used for the test
Quotation marks and the word “exactly” separate literal copy from visual instructions. Repeating the same sentence pattern for each panel also reduces ambiguity.
The generated result
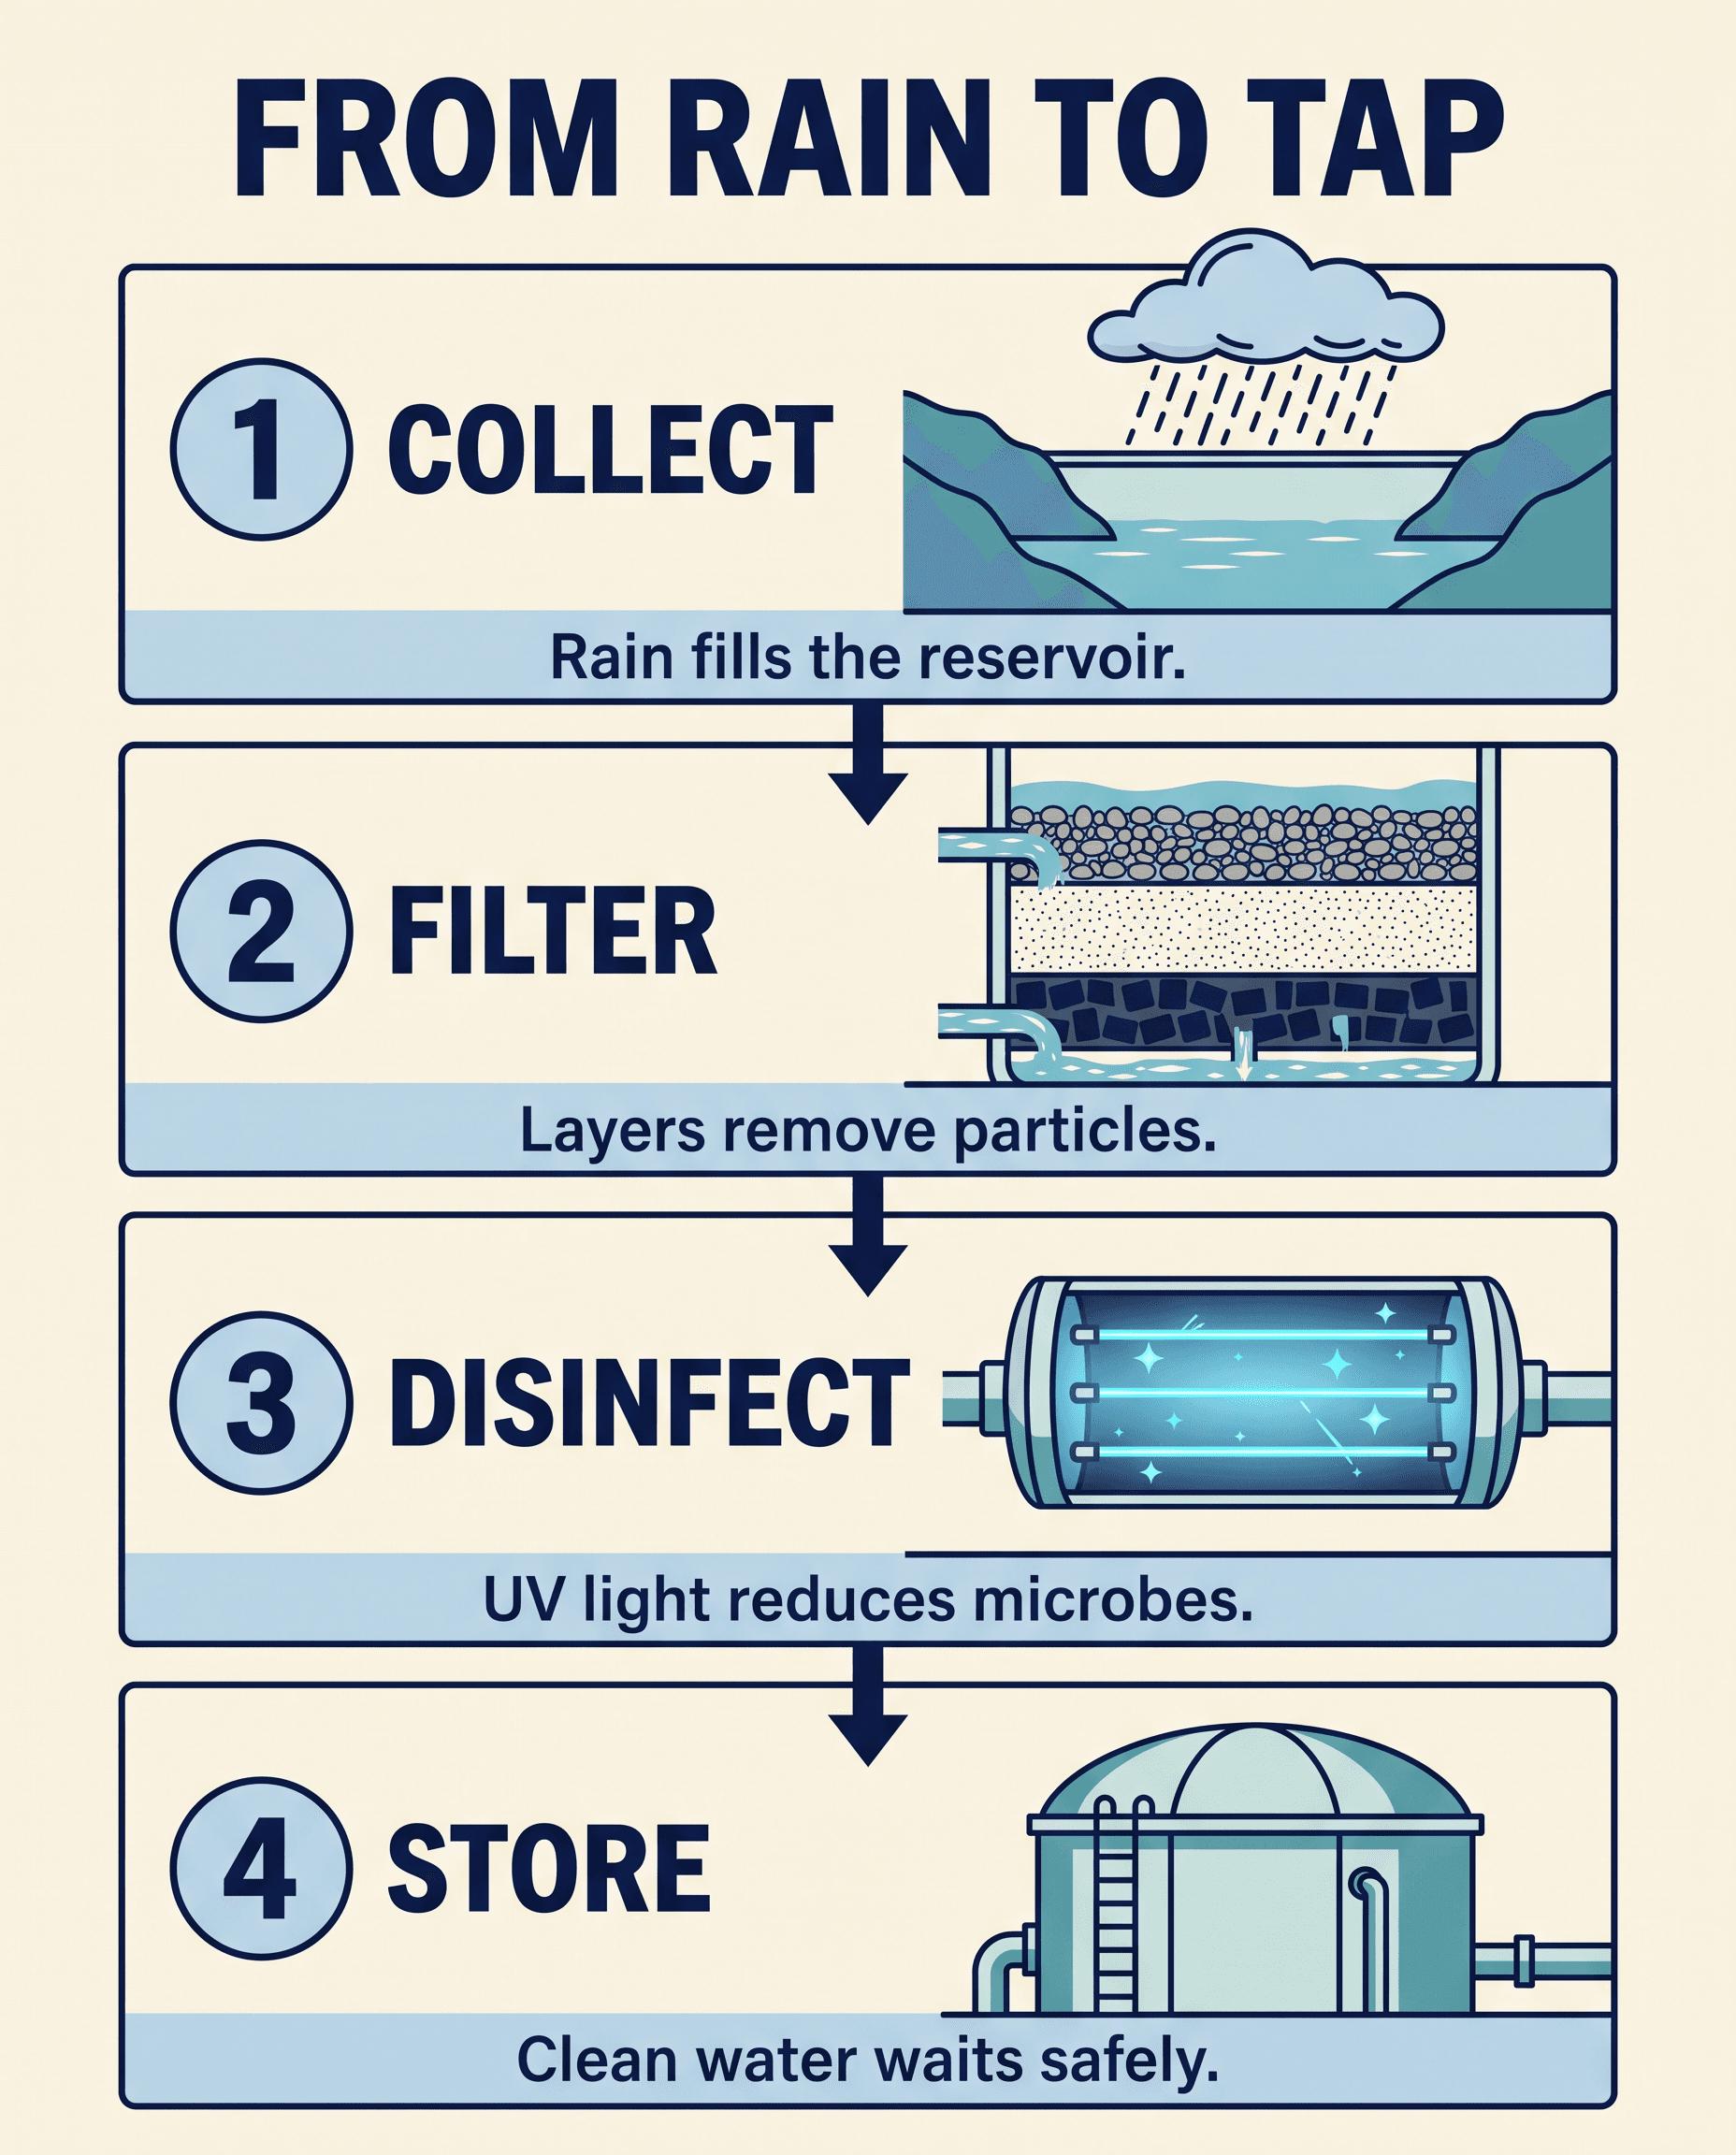
The result succeeded because the prompt did not ask the model to invent the explanation. It supplied the approved copy and used the model for layout and visual translation.
A reusable infographic prompt formula
Prompt patterns for different infographic types
Process infographic
Use numbered steps and one directional path. State whether it runs vertically, horizontally, clockwise, or along a timeline.
Comparison infographic
Use two equal columns, shared row labels, and parallel language. Ask for the same visual weight on both sides so the design does not imply a winner accidentally.
Timeline
Lock the date order, number of milestones, and direction. Give each milestone one headline, one sentence, and one icon.
Anatomy or system diagram
Name the central object, the exact callouts, and where labels should sit. Require non-crossing leader lines and prohibit invented labels.
Data summary card
Supply verified numbers and specify the visual form—bar, donut, counter, or comparison row. Do not ask the model to calculate or source statistics inside the image.
How to reduce text errors
- Put every required phrase in quotation marks.
- Use short labels and sentence-case captions.
- Spell unusual names explicitly if they are critical.
- Limit the number of font sizes and hierarchy levels.
- Say “no other words” when no creative copy is allowed.
- Generate one language at a time and proofread at full resolution.
- If one label is wrong, request a single targeted correction and restate what must remain unchanged.
The infographic QA checklist
Before using an AI-generated infographic, check:
- Is every word spelled exactly as approved?
- Are facts, numbers, dates, and units correct?
- Do arrows and connectors express the intended relationship?
- Is the reading order obvious without explanation?
- Does every icon match its caption?
- Are any words duplicated, invented, or missing?
- Is text readable at the final display size?
- Are brand, accessibility, and contrast requirements satisfied?
When not to generate the entire graphic as one image
Use a conventional design tool when copy changes frequently, numbers come from live data, localization must be pixel-consistent, accessibility requires selectable text, or the final asset carries regulated information. Nano Banana 2.1 is useful for concepting and producing a strong visual draft; it should not replace factual review or a maintainable source file.
Final takeaway
The best infographic prompt behaves like a mini design specification. Give the model approved text, a fixed structure, explicit visual metaphors, and a strict exclusion list. In our test, Nano Banana 2.1 followed all of those constraints in one run, but the safe workflow is still generate, proofread, and revise.
For the broader prompt framework, see the Nano Banana 2.1 Prompt Guide. You can create your own test in the WeShop Nano Banana generator.